Sunday, August 31, 2008
Associated Word List
Election, vote, money, 3 trillion dollars, too much, larger problems, bush, info. graphic, motion, educating people, influencing people, what we could have spent the money on, foreign oil, oil war, mixing infographics with cartoony style, end hunger and poverty related diseases, end foreign dependance on oil, universal health care for every american, pay half the world for a day, give every teacher a raise, end world hunger completely for a day, switch to solar power, the list goes on on what we could have spent, change, new people in office, new power, power in youth voters, power in the people, responsibility, helping the world, peace, ballots over bullets, illustrating how people can make a difference, every vote matters, people matter... to be continued

Wednesday, August 27, 2008
Richard Saul Wurman


Richard Saul Wurman (born 1935 in Philadelphia) is an American architect and graphic designer. He is considered a pioneer in the practice of making information understandable. He has written and designed over 80 books and created the TED conferences. In 1976 he coined the phrase information architect out of his reaction to a society that daily creates massive amounts of information, but with little care or order. He created the popular ACCESS travel guide books which were innovative in their use of mapping content by neighborhood. Simple, but effective use of colored text allowed the reader to quickly separate, locate and evaluate restaurants, museums, parks, and other categorical destinations. The design concept was based on how we seek information, in this case, by location. With this series of books, Wurman firmly established the purpose of information architecture.
He is a 2004 Medalist of the AIGA, which honored him as a design conference impresario.[1]
I am a personal fan of TED. I listen to their podcast every week and I find it endlessly interesting. It is really a great way to learn about all sorts of amazing things in all types of fields. If you go into to Itunes or their website you can find the archives. I really recommend the one on the scientist who studies Fungi, it is really surprising, and the guy who studies crows. Though I have never listened to one that I didn't like, so you really can't go wrong.
Edward Tufte

Edward Tufte has written seven books, including Visual Explanations, Envisioning Information, The Visual Display of Quantitative Information, and Data Analysis for Politics and Policy. He writes, designs, and self-publishes his books on analytical design, which have received more than 40 awards for content and design. He is Professor Emeritus at Yale University, where he taught courses in statistical evidence, information design, and interface design. His current work includes landscape sculpture, printmaking, video and a new book.
Nigel Holmes

Nigel Holems was born in 1942 in England. He graduated from The Royal College of Art in 1966, and worked as a freelancer for newspapers and magazines in England until 1977, when Walter Bernard hired him to work at Time Magazine in New York, to design what he calls "explanation graphics" — pictures that elucidate the subjects in the magazine.[2] Following 16 years at Time, he became a freelance designer, lecturer, and author of books on the subject including Wordless diagrams.
After a sabbatical he started his own company, which has explained things to and for a wide variety of clients, including Apple, Fortune, Nike, The Smithsonian Institution, Sony, United Healthcare, US Airways and Visa, and he continues to do graphics for publications such as Harper’s, The New York Observer and The New York Times.[3]
Nigel Holmes has written six books on aspects of information design. The latest, Nigel Holmes on Information Design, is a book-length interview with Steven Heller. It was published by Pinto Books in May 2006. Wordless Diagrams, from 2005, has been published in Chinese and Swedish editions as well as the original English.
Story 2
The scene opens on this quote "The Iraq war is expected to cost tax payers $3 trillion dollars" ... "Here is what we could have spent that money on..."
End our Dependence on Foreign Oil
1 purchased for $500,000,000,000.00 each
End hunger and poverty related diseases
1 purchased for $195,000,000,000.00 each
End World Hunger Completely for 1 yr
1 purchased for $195,000,000,000.00 each
Universal Health Care for Every American (300 million of us)
1 purchased for $920,100,000,000.00 each
Pay Half the World for a Day
1 purchased for $13,204,400,000.00 each
finish repairing the damage done by Katrina
1 purchased for $200,000,000,000.00 each
give every teacher a rai$e
1 purchased for $100,000,000.00 each
Broadband To Every U.S. Home
1 purchased for $100,000,000,000.00 each
Switch to Solar
1 purchased for $420,000,000,000.00 each
Every Song in the iTunes Library
2 purchased for $7,000,000.00 each
100 New Libraries
1 purchased for $5,000,000,000.00 each
revamp the u.s. education system
1 purchased for $100,000,000.00 each
Increase sustainable Organic Produce in the US
1 purchased for $10,000,000,000.00 each
The Hope Diamond
1 purchased for $250,000,000.00 each
New Clothing, Shoes, Coats, and School Supplies for Ten Million Children
1 purchased for $10,000,000,000.00 each
Hubble Space Telescope
1 purchased for $1,500,000,000.00 each
New National Power Grid
1 purchased for $100,000,000.00 each
Wal-Mart Stores, Inc. (Public, NYSE:WMT)
1 purchased for $222,520,000,000.00 each
Google
1 purchased for $2,499,750,000.00 each
Each of these things would flash across the screen and the first would be rather slow and illustrated and then the facts would speed up and the text would get larger and larger until the screen was black and then the words in white would appear on the screen: "good design makes choices clear"
End our Dependence on Foreign Oil
1 purchased for $500,000,000,000.00 each
End hunger and poverty related diseases
1 purchased for $195,000,000,000.00 each
End World Hunger Completely for 1 yr
1 purchased for $195,000,000,000.00 each
Universal Health Care for Every American (300 million of us)
1 purchased for $920,100,000,000.00 each
Pay Half the World for a Day
1 purchased for $13,204,400,000.00 each
finish repairing the damage done by Katrina
1 purchased for $200,000,000,000.00 each
give every teacher a rai$e
1 purchased for $100,000,000.00 each
Broadband To Every U.S. Home
1 purchased for $100,000,000,000.00 each
Switch to Solar
1 purchased for $420,000,000,000.00 each
Every Song in the iTunes Library
2 purchased for $7,000,000.00 each
100 New Libraries
1 purchased for $5,000,000,000.00 each
revamp the u.s. education system
1 purchased for $100,000,000.00 each
Increase sustainable Organic Produce in the US
1 purchased for $10,000,000,000.00 each
The Hope Diamond
1 purchased for $250,000,000.00 each
New Clothing, Shoes, Coats, and School Supplies for Ten Million Children
1 purchased for $10,000,000,000.00 each
Hubble Space Telescope
1 purchased for $1,500,000,000.00 each
New National Power Grid
1 purchased for $100,000,000.00 each
Wal-Mart Stores, Inc. (Public, NYSE:WMT)
1 purchased for $222,520,000,000.00 each
1 purchased for $2,499,750,000.00 each
Each of these things would flash across the screen and the first would be rather slow and illustrated and then the facts would speed up and the text would get larger and larger until the screen was black and then the words in white would appear on the screen: "good design makes choices clear"
Story 1
The scene opens with the quote " The Iraq War is expected to cost tax payers $3 trillion dollars..." The it will fade out and fading in will say " here is what we could have spent that money on:"
This quote will then appear on the screen:
"we could give medicaid level health insurance to every uninsured American at $3,067 per person." have graphics that illustrate medicaid and giving it to people.(not sure what that would look like...)
Then the screen will transition into the " or we could buy 142 million Americans energy-effcient hybrid cars" Little cars would drive across the screen.
The last quote would flash across the screen and say "or we could send 20 million students to college" It would show little cartoon college students going to college.
then it would say "Good Design Makes Choices Clear..."
Project Brief
My challenge is to create a motion graphic with any tool available that accurately illustrates a statistic so that viewer can understand and experience the information being conveyed.
Tuesday, August 26, 2008
Jeremy Shellhorns AIGA Posters!


Hey I don't know if everyone saw this, but these are Jeremy's Aiga voting posters.
If I had 3 trillion dollars...
End our Dependence on Foreign Oil
1 purchased for $500,000,000,000.00 each
End hunger and poverty related diseases
1 purchased for $195,000,000,000.00 each
End World Hunger Completely for 1 yr
1 purchased for $195,000,000,000.00 each
Universal Health Care for Every American (300 million of us)
1 purchased for $920,100,000,000.00 each
Pay Half the World for a Day
1 purchased for $13,204,400,000.00 each
finish repairing the damage done by Katrina
1 purchased for $200,000,000,000.00 each
give every teacher a rai$e
1 purchased for $100,000,000.00 each
Broadband To Every U.S. Home
1 purchased for $100,000,000,000.00 each
Switch to Solar
1 purchased for $420,000,000,000.00 each
Every Song in the iTunes Library
2 purchased for $7,000,000.00 each
100 New Libraries
1 purchased for $5,000,000,000.00 each
revamp the u.s. education system
1 purchased for $100,000,000.00 each
Increase sustainable Organic Produce in the US
1 purchased for $10,000,000,000.00 each
The Hope Diamond
1 purchased for $250,000,000.00 each
New Clothing, Shoes, Coats, and School Supplies for Ten Million Children
1 purchased for $10,000,000,000.00 each
Hubble Space Telescope
1 purchased for $1,500,000,000.00 each
New National Power Grid
1 purchased for $100,000,000.00 each
Wal-Mart Stores, Inc. (Public, NYSE:WMT)
1 purchased for $222,520,000,000.00 each
Google
1 purchased for $2,499,750,000.00 each
I found this website where I could spend as much money as President Bush is spending in Iraq, and here is what I spent my 3 trillion dollars on.
1 purchased for $500,000,000,000.00 each
End hunger and poverty related diseases
1 purchased for $195,000,000,000.00 each
End World Hunger Completely for 1 yr
1 purchased for $195,000,000,000.00 each
Universal Health Care for Every American (300 million of us)
1 purchased for $920,100,000,000.00 each
Pay Half the World for a Day
1 purchased for $13,204,400,000.00 each
finish repairing the damage done by Katrina
1 purchased for $200,000,000,000.00 each
give every teacher a rai$e
1 purchased for $100,000,000.00 each
Broadband To Every U.S. Home
1 purchased for $100,000,000,000.00 each
Switch to Solar
1 purchased for $420,000,000,000.00 each
Every Song in the iTunes Library
2 purchased for $7,000,000.00 each
100 New Libraries
1 purchased for $5,000,000,000.00 each
revamp the u.s. education system
1 purchased for $100,000,000.00 each
Increase sustainable Organic Produce in the US
1 purchased for $10,000,000,000.00 each
The Hope Diamond
1 purchased for $250,000,000.00 each
New Clothing, Shoes, Coats, and School Supplies for Ten Million Children
1 purchased for $10,000,000,000.00 each
Hubble Space Telescope
1 purchased for $1,500,000,000.00 each
New National Power Grid
1 purchased for $100,000,000.00 each
Wal-Mart Stores, Inc. (Public, NYSE:WMT)
1 purchased for $222,520,000,000.00 each
1 purchased for $2,499,750,000.00 each
I found this website where I could spend as much money as President Bush is spending in Iraq, and here is what I spent my 3 trillion dollars on.
Thursday, August 21, 2008
School


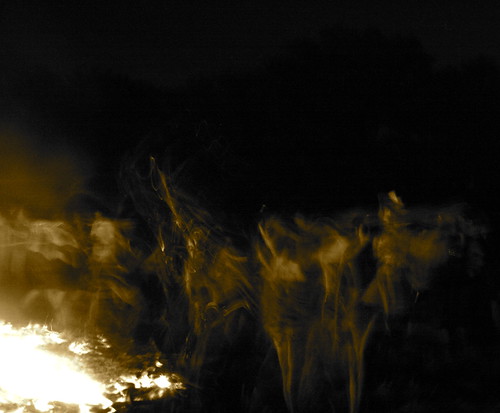
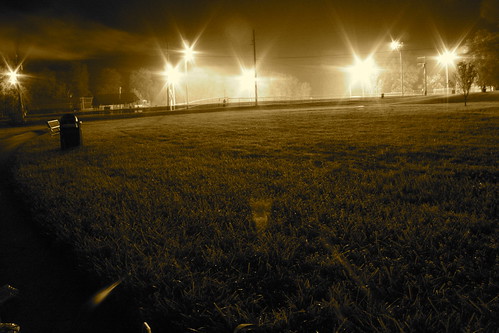
So it's the first day of school and for the first time in a long time I feel like I am in the right place, with the right intent, and I am really excited about my major. Last year after the first project I had a count down in my planner to when I could drop graphics and pray the photomedia major was going to actually happen. Although I am not always in love with graphics, it feels nice not to be dreading the upcoming months and to be actually looking forward to it. It was a difficult choice not to go in to photomedia major, but with the combination of the way it is being run, and how much I found my interests had changed by the end of the last school year, I am really happy with my choice.
Now to contradict everything I have said about photography, here are some of my shots from over the summer that I really liked.
Subscribe to:
Posts (Atom)